Getting started with Risktree®
How do you start modelling risks using attack trees? This short guide will explain the basic features and how to build your first RiskTree.
Think like an attacker
The first thing to do is determine your attacker goals (also known as bad outcomes). These are the things that an attacker might want to achieve against the asset that you are assessing. Perhaps they will want to steal data or cause financial loss. Maybe they will be seeking to tamper with your data, or damage your reputation. RiskTree is a framework that lets you choose any attacker goals that you choose to model.
RiskTree® Designer
Log in to RiskTree and select New RiskTree, either by clicking the green button or from the Identify and Assess menu. You will see the start page for RiskTree Designer.
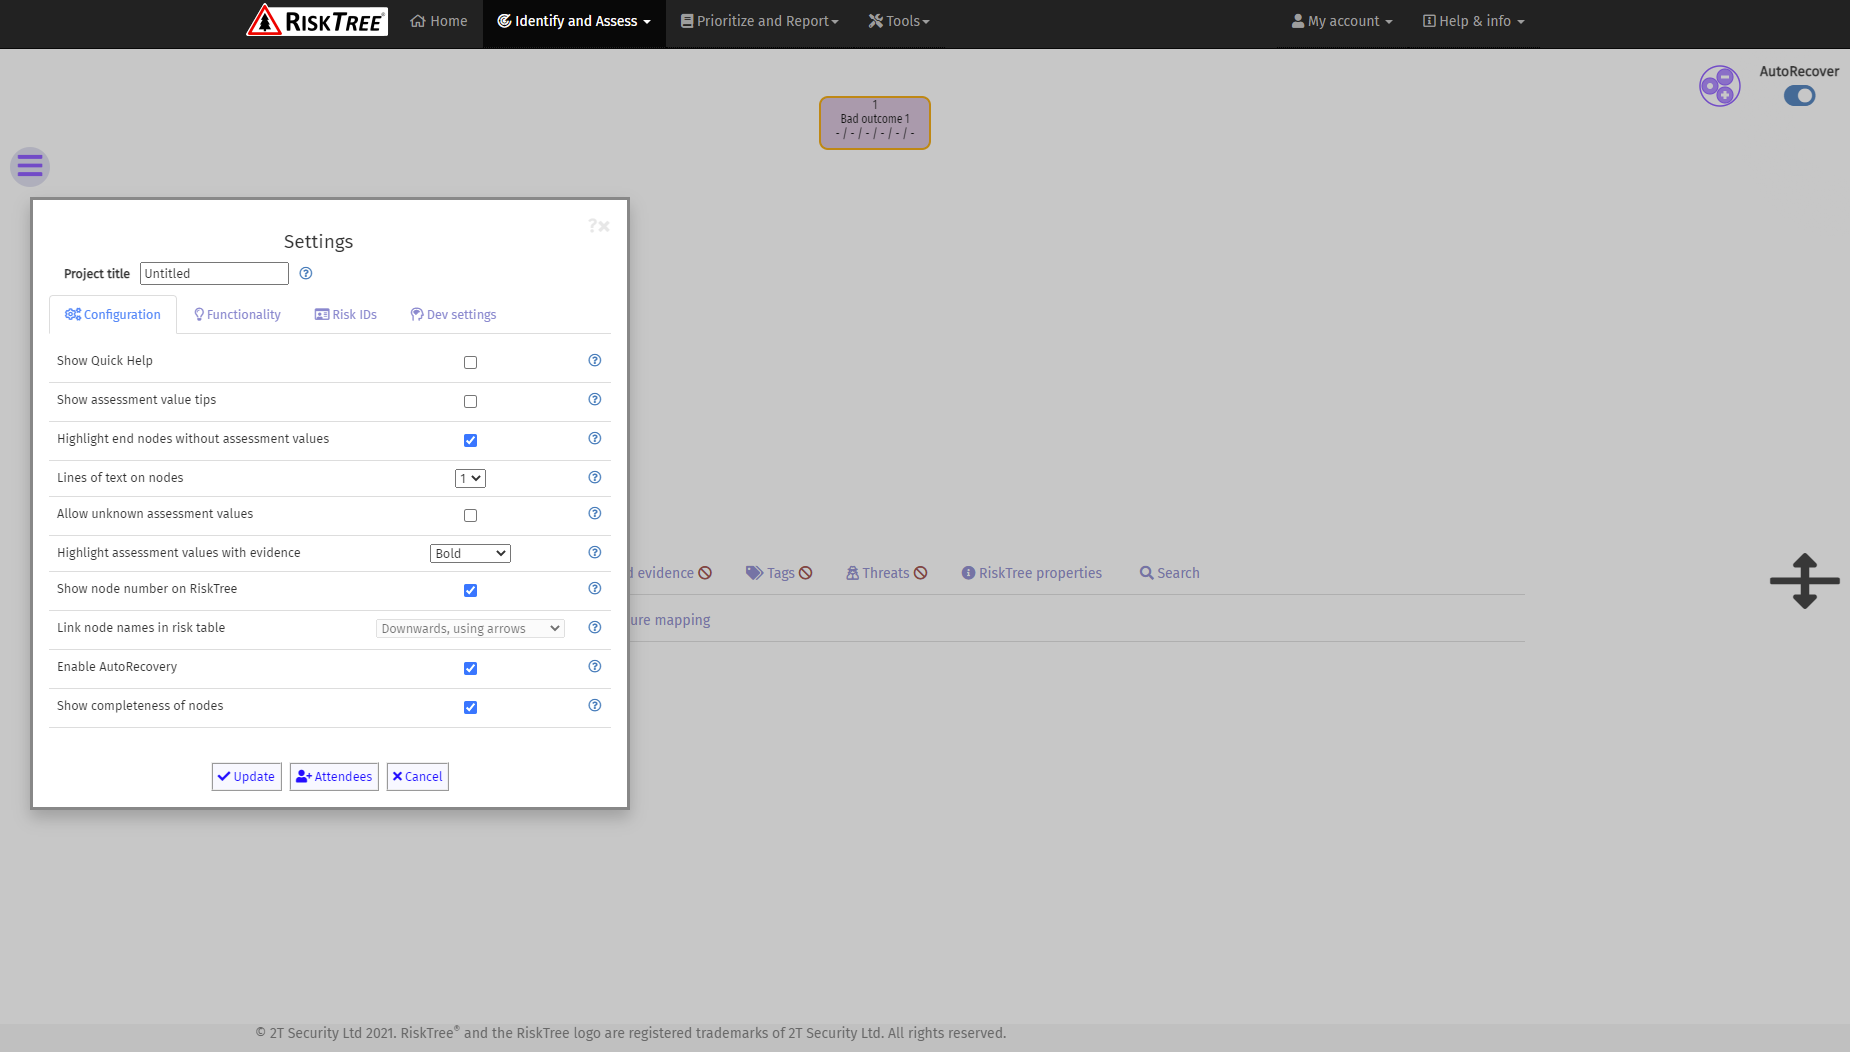
The first thing to do is enter a name for your project. This might be the name of the asset that you are assessing. For now, leave all of the other settings at they are (although you might want to tick the first box to enable the context-sensitive help). You now have a screen with a single node, called Bad outcome 1. There are a few other items on the screen that need explaining before we start to build a tree.
- The RiskTree itself (top half of the screen). This space is where your RiskTree diagram will appear.
- The information tabs (bottom half). These tabs show information about the RiskTree as you build it.
- The designer menu is on the left of the designer and can be expanded to show function names or collapsed so only the icons are showing.
- The zoom controls (top right). Click on the + and – to change the scale of the RiskTree on the screen. The • resets the zoom to the default.
- The red warning triangle (top right) lets you know that there have been changes on the risk tree since the last save.
- The splitter control (middle right). Dragging this up and down lets you apportion the space between the RiskTree diagram in the top half of the screen, and the information tabs in the bottom half.
- The menu bar (black bar along the top of the screen). More features are in the Identify and Assess menu. Other RiskTree functions and tools are on other drop-down menus.


Build your first tree
It’s now time to start building your tree. Decide which bad outcome you are modelling first, and make it the name of the root node. This is done via the node menu, which is accessed by moving the mouse cursor over the name of the node.
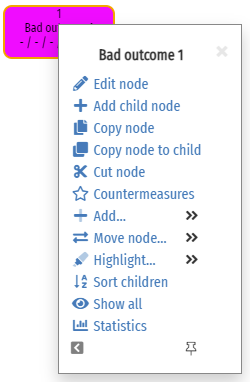
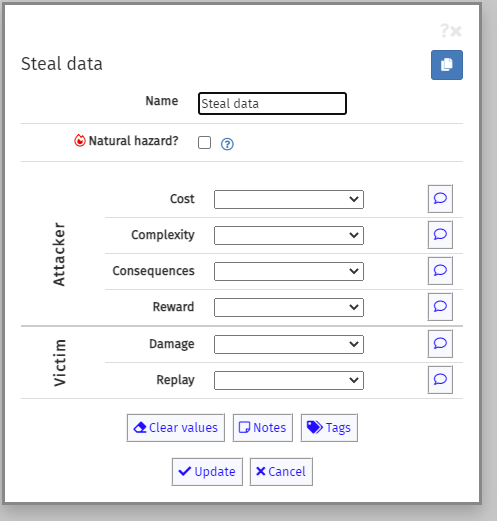
Click on Edit node. This opens the node editor box, where you will enter the node name in the first field:
For the root node, you can ignore the remainder of the fields on the form, which we will use later. For now, just click on the Update button.
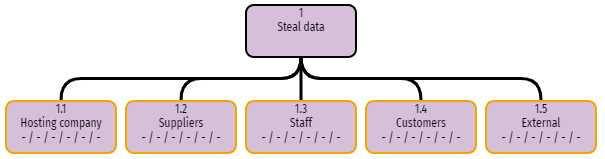
The next part of the tree needs to be built. There are different approaches that can be taken, but one that works well is to first consider the types of attacker. This will probably depend on the type of asset being assessed. If it’s an IT system that is hosted in the cloud then the attackers could conceivably be:
- Hosting company staff – the system and its data are stored on the IT that they manage
- Any suppliers who are involved – perhaps staff of companies that provide software, have designed or built the system, or who maintain the system
- Staff – who might have a variety of roles, for example administrators, developers, and regular users.
- Customers – who might have accounts on the system, but should have a very low level of privilege.
- Externals – anyone else who has no legitimate reason to access the system
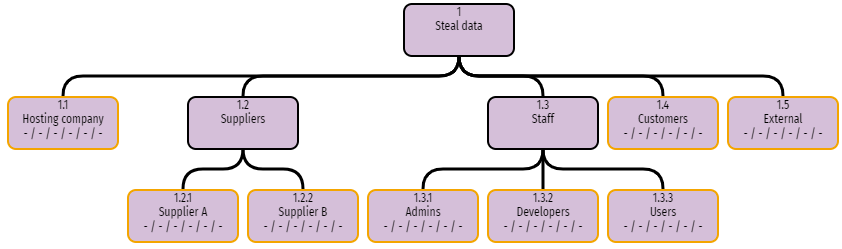
We can create these as nodes in the tree. Open the node menu on the root node again, and select Add child node. The node editor opens again, and we can enter the name of our first child node: in this case, Hosting company. Again, leave the remainder of the form and click Update. Repeat this for the other four potential attackers. Your tree should now look like this:
The different staff roles can be added as children from the Staff node. If there are multiple suppliers, these can also be added. Your tree might now look like this:
The end nodes have orange borders because they are incomplete. In RiskTree, the end nodes represent the risks that we are assessing, and they need to have assessment values applied. These values are set to - by default, hence the six - symbols (separated by slashes) beneath each node name. Of course, the end nodes on the current tree are not actual risks: we need to build the representation of the risks beneath.
Putting on the risks
Let’s consider the risks from the hosting company staff. At this stage try not to think about the controls that will be in place to protect your data – just focus on possible attacks. There might be several that you can think of, for example:
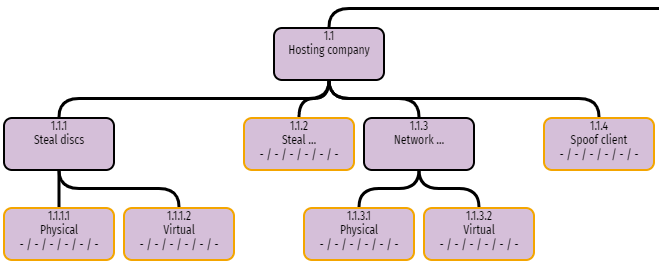
- Steal the discs that hold your data, bearing in mind that there are physical disc units in the data centre, but there will also be logical discs (the data storage that you can see through the cloud hosting console).
- Collect your data as they traverse the network in the data centre, through traffic sniffing.
- Steal your credentials from the user management system and log on as you, and then copy the data.
- Set up another virtual machine in the cloud and establish a trust relationship with your system.
We can then build a structure to represent this under the Hosting company node. This part of the tree could now look like this:
You can now repeat this process to build up risk structures for every other branch of the tree following the process just described. This can be done as a solo process, if you have enough knowledge of the asset, or it can be developed through running a Risk Discovery Workshop in which a small number of experts contribute their knowledge.
The process tends to work best by considering each branch in turn, rather than jumping back and forth. However, it’s fine to revisit a previous branch if you realize that there is another attack that didn’t come to mind the first time around.
You can move the tree around on the screen by clicking and dragging; the mouse cursor will turn into a four-pointed arrow when the tree can be dragged.
Assessment values
Whilst the completed RiskTree structure has some use – in presenting the risks to the asset in a structure manner – in order to perform a risk assessment, we need to add more data. This is in the form of assessment values. For standard nodes, there are six of these:
| Name | Range | Description |
|---|---|---|
| Cost | 1-6 | The cost to the attacker of carrying out the attack. For example, do they need to purchase equipment or cloud compute capability, or bribe staff? |
| Complexity | 1-6 | The complexity of the attack, in terms of knowledge required by the attacker. This could be technical capability, knowledge of the organization or system being attacked, or just the number of steps required to achieve the attack. |
| Consequences | 1-6 | How likely is the attacker to be caught, and how severely will they be punished if they are? Will they lose their job (if they are an insider); will they be fined or imprisoned? |
| Reward | 1-6 | What reward is there for the attacker? Is there a financial gain, or are they doing it for fun? |
| Damage | 1-9 | What is the loss caused to the organization being attacked? |
| Replay | 0-6 | How often could the attack be carried out (not necessarily by the same attacker)? |
For the values assessed financially, typically Cost, Reward, and Damage, using an order of magnitude scale works best. In other words £1,000 would score a 3, £100,000 is a 5, and £1 billion (for damage) is a 9. Replay should also be order of magnitude, which is why it can be scored as a 0 – this value means that it is a one-off attack. A 6 (millions) would most likely be a phishing campaign or similar.
The key thing to remember when assigning values though, is to keep them relative. Ensure that an attack that is more expensive than another, has a higher cost score, and so on. If you are running a workshop to build the trees, get consensus from workshop attendees and always ensure consistency in scoring. The scores might be subjective, but this matters less when the output is to be a relative ordering of the risks. Also, remember to exclude the effects of any controls that you might have implemented – these will be added in a later step.
As you are adding values, there is likely to be discussion about why a particular score has been chosen. It is important to capture this information so that someone reviewing the assessment can understand the reasoning behind the choice of values. This evidence is stored by clicking on the speech bubble icon to the right of the drop-down for each score. This opens the evidence box:
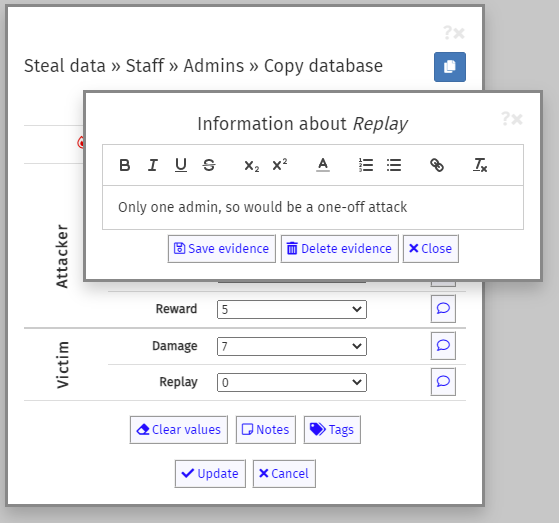
You can format the evidence notes using the buttons above the text entry field. Formatting is cleared by clicking on the T× button. When complete, click on the Save evidence button to close the editor. The speech bubble in the button next to the assessment value will become solid to indicate that evidence is held.

An intrinsic assessment
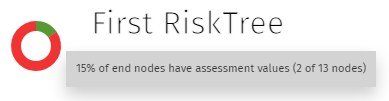
Once you start to apply assessment values, a pie chart will appear near to the menu bar showing the completion status of the nodes. This starts off mostly red, but the green increases until all of your end nodes have values (and none have orange borders).
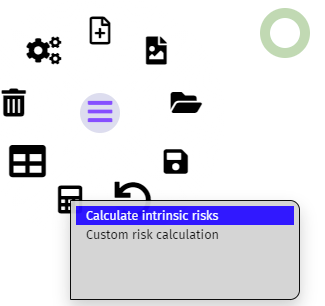
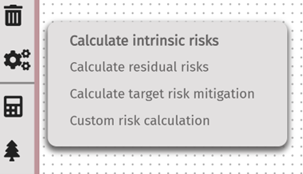
At this point you can perform the intrinsic risk assessment. Click on the calculator icon in the sidebar and select the level of calculation.
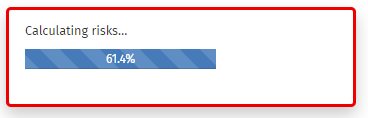
RiskTree will now start the risk calculation process. A progress bar shows how far the calculation has gone. This will disappear once the calculation is complete.
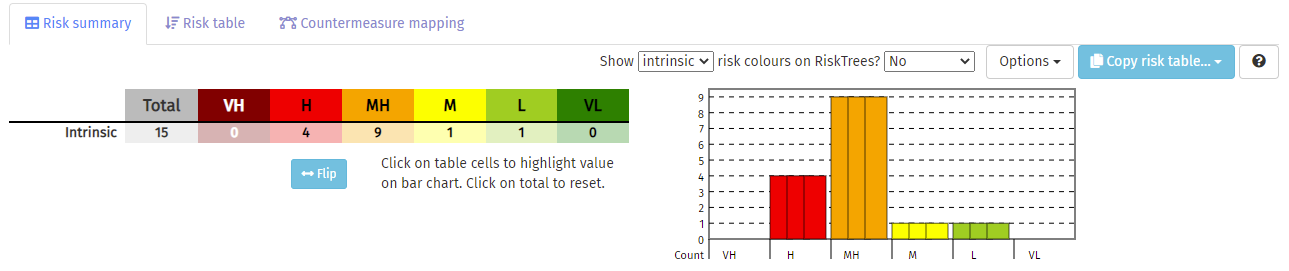
Information about your risks will now appear in the Risks tab below the RiskTree diagram. The first tab to be shown will be the Risk summary, which provides a concise view of your risks in both a table and a bar chart.
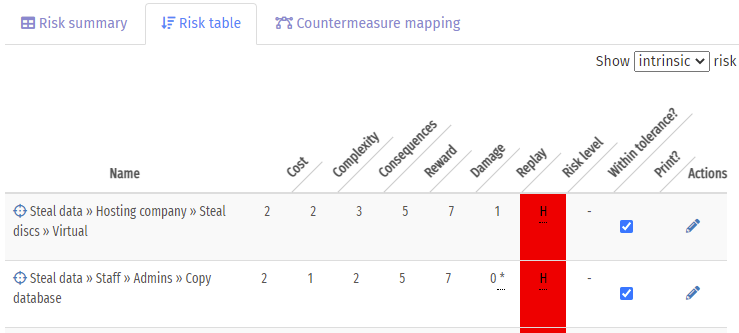
A more detailed view of each risk is on the Risk table tab. This will list each of the risks, from highest to lowest:
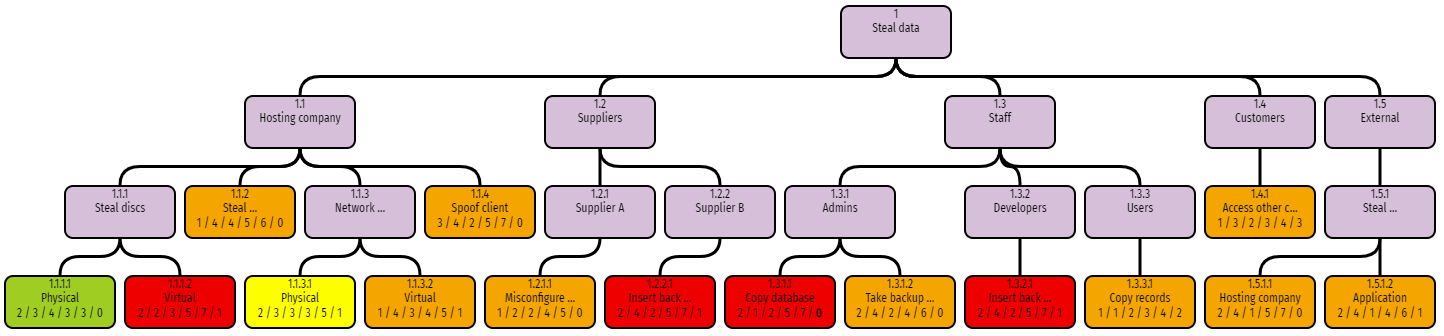
The best way of getting a good overview of the risks levels is to colour the RiskTree by risk level. To do this, you need to change the drop-down above the bar chart to state that the risk colours are required on the end nodes.
You have now created an intrinsic risk assessment. Most of these risks look scary, but don’t worry: this is because we haven’t looked at the countermeasures yet. The next instalment of this series will cover this topic.