RiskDisc™
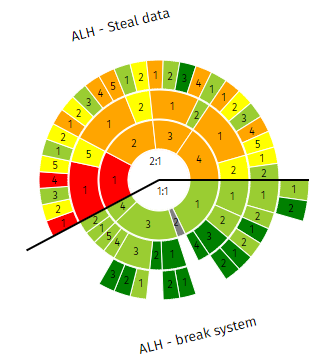
RiskDisc provides a compact and effective overview of the risks in the files uploaded to the Risk Processor. It converts the set of RiskTrees into a circular diagram, with the root nodes for the bad outcomes at the centre. Each level of the trees forms a ring around the centre; thus, a RiskTree with four levels will appear as a RiskDisc with three rings around the core.
Each node is coloured to match its risk level, and the risk for a node with one or more children is taken from the highest risk child. If multiple RiskTrees are uploaded to the Processor then they are separated in the RiskDisc by black lines, with labels around the edge. The riskbands and colours used in the RiskDisc will match those of any uploaded configuration file.

Moving your mouse over the RiskDisc will show information about the nodes to the right, including the node number and name, the calculated risk level(s), and the node from which the risk level is inherited if the cursor is not on a risk (end node). There is an checkbox to let you view the calculated risk score for each risk in the information box.
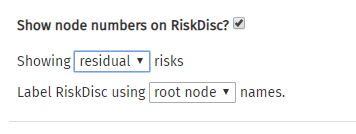
The RiskDisc can be changed in a number of ways. A drop-down lets you show different levels of risk (intrinsic, residual, and target) if they have been calculated. The node numbers are displayed on each segment of the RiskDisc, and these can be removed by unticking the Show node numbers on RiskDisc checkbox. If multiple RiskTrees are being displayed on the RiskDisc then by default the edge labels show the name of their root node. You can change this to be the title of the RiskTree project by changing the Label RiskDisc using… drop-down.

At the bottom of the RiskDisc tab, there is a text editor that allows you to enter your own commentary on the RiskDisc. This will be saved into the report file, and included in the report printout, and allows you to document key features of your RiskDisc.
If you want an image file of the RiskDisc, perhaps to use in a report or presentation, click on the button. This will open the Save chart image box.