Network security
Overview
One of the key decisions that we made when designing RiskTree was that we wanted to perform the process using as little data as possible from our clients. We don't want to know what your risks are, the names of your systems, or the notes that you add to your risks. All that we need to see is the assessment values for the nodes, and the assessment value adjustments for countermeasures (and the confidence values if you have used these).
In order to achieve this, all of the 'textual' information (names, notes, evidence, tags, etc.) is removed from the data before securely uploading to our servers. We then perform the risk calculations and return the scores back to you, and your browser reassembles all of the data to create the RiskTree that you then view. This process, whilst more complex, protects you against attacks that attempt to intercept your data as they travel across the internet, and attacks on our servers.
Technical measures
All of the traffic between your browser and our servers is passed over an encrypted link. We only allow TLS1.2; earlier protocols (including SSL) are blocked. The little data that we do receive from you are not written to file, but held in memory on our servers whilst they are processed, and then get cleared down when the calculation ends and the results are returned to you. Even the data that you do send across is not stored in our logs, which just record which pages you request.
Getting confidence
This all sounds good, but how can you check that we really don't see all of your data. It is difficult, but there is a fairly quick way of checking what data get uploaded to our servers using the Chrome browser. Follow the steps below (you can always use a dummy tree for testing to be really safe).
- Go to either the Designer or Processor. In Designer, load a tree; in Processor, select a tree (but don't click Generate report yet)
- Open the Developer Tools in Chrome (CTRL+SHIFT+i, or click on the Chrome menu button () and select More tools > Developer tools
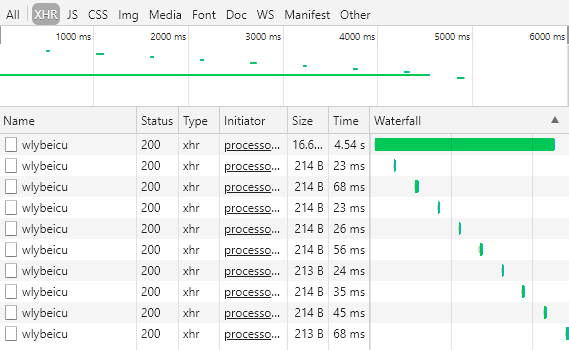
- In the new Developer Tools window that opens, click on the Network tab, then the XHR button.

- If you are in Designer, start the risk calculation (). In Processor, click the button.
- You will see a series of items appear in the Developer Tools window with a random-looking set of letters. Each of these is a request to the server. The first request submits your risk data; the
others, made at half-second intervals, check on the progress of the calculation so that the progress bar can be updated. The random letters are merely a unique code to ensure that the server provides
the correct progress back to your browser. In the example below, the code is
wlybeicu.

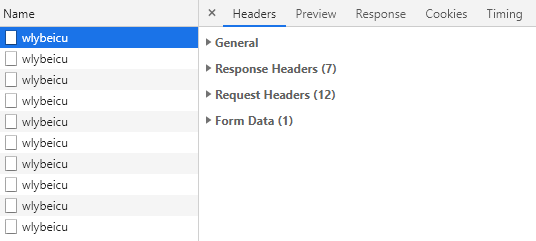
- Click on the first of these items (it should have the largest size shown in the Size column, and have the largest time taken, in the Time column). A new pane
will open, in which you should click on Headers.

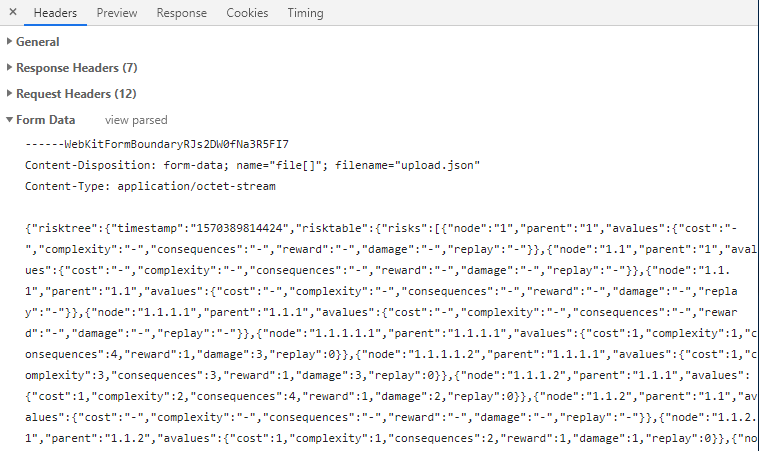
- Finally, click on the Form data heading, and then View source.

- You can now read through the contents of the data that were uploaded to the RiskTree servers for calculation, and assure yourself that none of your sensitive risk names, notes, evidence, or tags have been uploaded.
If you have any questions about this, please get in touch.