Statistics
The Statistics function opens a pop-up box containing information about the risks and countermeasures for the selected node and all of its children. These are presented graphically.
Risk statistics
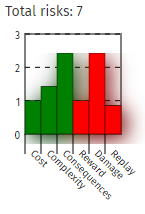
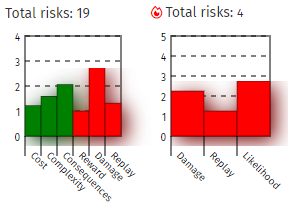
The bar chart shows details for the assessment values on all of the end nodes in the selected branch of the RiskTree. By default, the mean (average) values are shown, as the main bars. The bars are green for values where higher values are better (as they will cause the risk to be lower - these are the cost, complexity, and consequences). The red bars are used for values where higher values lead to higher risks (reward, damage, and replay). Moving the cursor over a bar will display the value at the bottom of the pop-up box.

If you have any Hazard risks, their information will be shown on a separate bar chart to the right, as these use a different set of assessment values. In other regards the chart works the same way as described above. The chart title will indicate the number of risks represented on each chart.

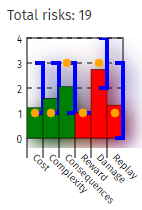
Check-boxes in the chart key allow the charts to display the range for each of the assessment values (i.e., the highest and lowest values). This appears as a blue line on the chart, linking the two values. The mode can also be displayed in this way, and is shown as one or more orange dots on the chart. Moving the mouse cursor over the range indicator or the mode dots displays the values at the bottom of the pop-up box.

Countermeasure statistics
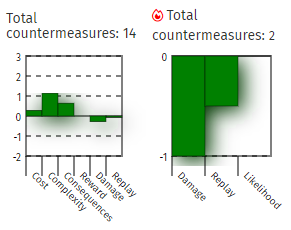
If the chosen tree branch includes countermeasures, charts for them are shown beneath the risk charts. These show the same types of value, but for the assessment value change factors used on the countermeasures. Because of this, the charts will show items with scores below zero (where a countermeasure reduces a relevant value). Bars are shown in red if the scores will lead to a risk increase, and green if they contribute to a risk reduction.

How does this help?
The statistics function has been provided to let you analyse your risks in another way. For example, if you see that the risks on your tree (or a branch of the tree) all have low Complexity scores, and they require further mitigation, but the countermeasures do not affect Complexity, this suggests that you should look to identify countermeasures that increase the complexity of the attacks, as this will provide more effective mitigation.