The Tags tab in Designer
Viewing tag information
Tag information is shown beneath each risk in the risk table (on the Risks tab), and below each countermeasure on the Countermeasures tab. The relevant tags will be shown in blue beneath the name of the item.

The Tags tab, below the RiskTree, shows details of the tags and tag sets in use on your RiskTree. To see the tags, click on the Tags sub-tab. This lists all of the tags that are in use (i.e., have been applied to at least one node or countermeasure).

Within the tags table, each tag is placed on a separate row. Each row contains the following information:
- Tag name - shown as a tag (i.e., white text on blue label)
- Any tag notes - if a tag has a link, this will be shown by the symbol. Hovering over this symbol shows the link address; clicking on it opens the link in a new tab
- A toggle switch ( ) to highlight the nodes and countermeasures that have this tag
- The Tag set to which the tag belongs
- Any nodes that have this tag
- Any countermeasures that have this tag
- A button ( ) to directly edit the tag notes
Clicking on the Tag and Tag set column headings will sort the table by these attributes.
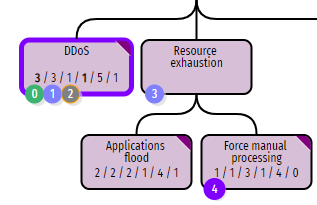
The toggle switches highlight any node that has the relevant tag with a thick purple border, and any countermeasure with a large purple disc, as shown for the DDoS node and CM4 below:

You can filter the tag sets that are shown on the tab by clicking on the button. A drop-down menu will appear, listing all of the tag sets in use. Untick those that you do not want to see, and these tags will be hidden in the list. This feature can be very useful if you just want to see information about one type of tag. For example, if you have tagged your countermeasures using the ISO27001 tag set, showing just these tags and the countermeasures that they affect give you a starter for an ISO27001 Statement of Applicability. Alternatively, filtering to just show risk owner tags provides you with a list of risks grouped by owner.

Click on the button to show all tags again. Whilst any tag sets are filtered, the Filter button will have red text.
The contains the following features:
- - this will remove all of the tags from the current RiskTree
- Show tag set code in tags - if ticked, any tags that belong to a tag set with a code will show this code as well as the tag name. For example, tag 6.1.1 from the ISO27001 set would be shown as 27k 6.1.1
- Include in printed report - if ticked, the contents of this tab will be included if the page is printed
Viewing tag set information
The main Tags tab has a second sub-tab for tag sets:

The tag sets table contains the following information;
- The Tag Set name
- The short code that can be added to tags automatically to show their set
- Any tag set notes - if the tag set has a link, the address will be shown beneath the notes, and will open the link in a separate tab if clicked
- A toggle switch ( ) to highlight the nodes and countermeasures that have tags in this tag set. This will also change the toggle switches for all tags in this tag sets on the Tags sub-tab
- The number of tags in use from this tag set
- The total number of tags that are in this tag set and have been loaded into RiskTree
Tag distribution charts
These are charts that let you see the relative proportion of each type of tag that have been used within each tag set. For example, if you have tagged your risks with risk owners, the chart provides you with a quick way of seeing the relative number of risks owned by each person.
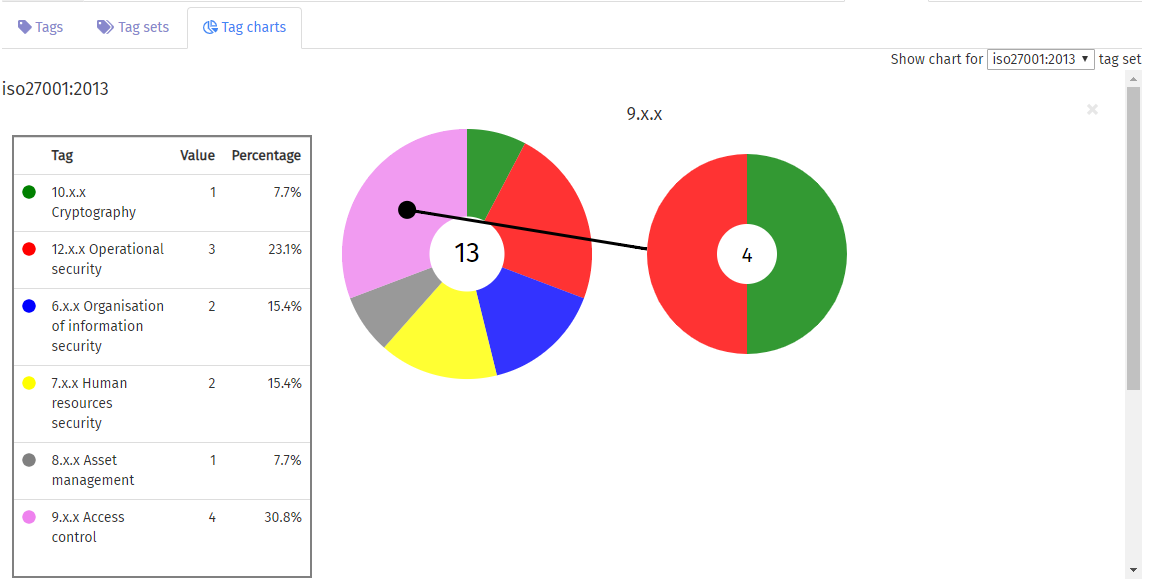
Some tag sets, with large numbers of tags, will split the charts into groups of tags. The ISO27001 tag set does this, and will show one chart segment for each of the 14 clauses in the control set, and aggregates each of the individual controls within these clauses. Moving the cursor over a segment will show the clause number and the name of the clause, for example, 8.x.x Asset management. Clicking on these segments will create a separate pie chart showing the tag distribution within this clause. The diagram below shows this for the Access control clause, which contains four tags. The right-hand pie chart shows that there are two tags in use in this clause, and each is used twice (as they each have 50% of the pie chart).
One tag distribution chart can be shown at a time. If multiple tag sets have been used, the distribution chart can be changed by using the drop-down in the top-right corner of the tab.
