Assessing bow-ties
Introduction
RiskTree goes beyond standard bow-tie diagrams, and lets you create bow-tie assessments. These use the information provided about the risks, countermeasures, consequences, and mitigations to assess and prioritize the outcomes identified as the bow-tie is built.
The assessment process looks at each outcome in turn, and considers the risks and consequences for each. As assessment will be made for each of the intrinsic, residual, and target values. The system identifies the worst case for each outcome, which will be the highest risk leading to the most severe consequence.
Assessment types
There are three types of assessment calculation that can be performed, depending on your risk appetite. All outcomes in a RiskTree assessment report will be calculated using the same type of assessment.
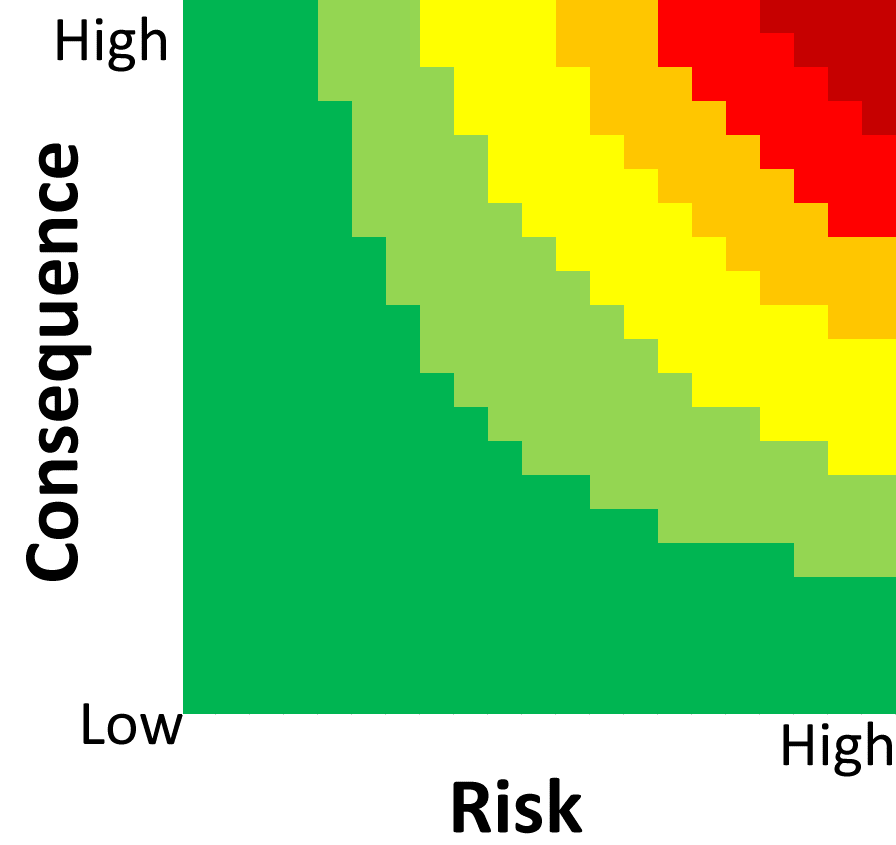
OpenThis assessment type multiplies the worst risk score by the worst consequence score, and scales the result into the range 0 – 100. Whilst being the most 'obvious' way to combine the values, it has the disadvantage of skewing the scores down. This might be appropriate for an organization with a risk appetite of Hungry or Open. |
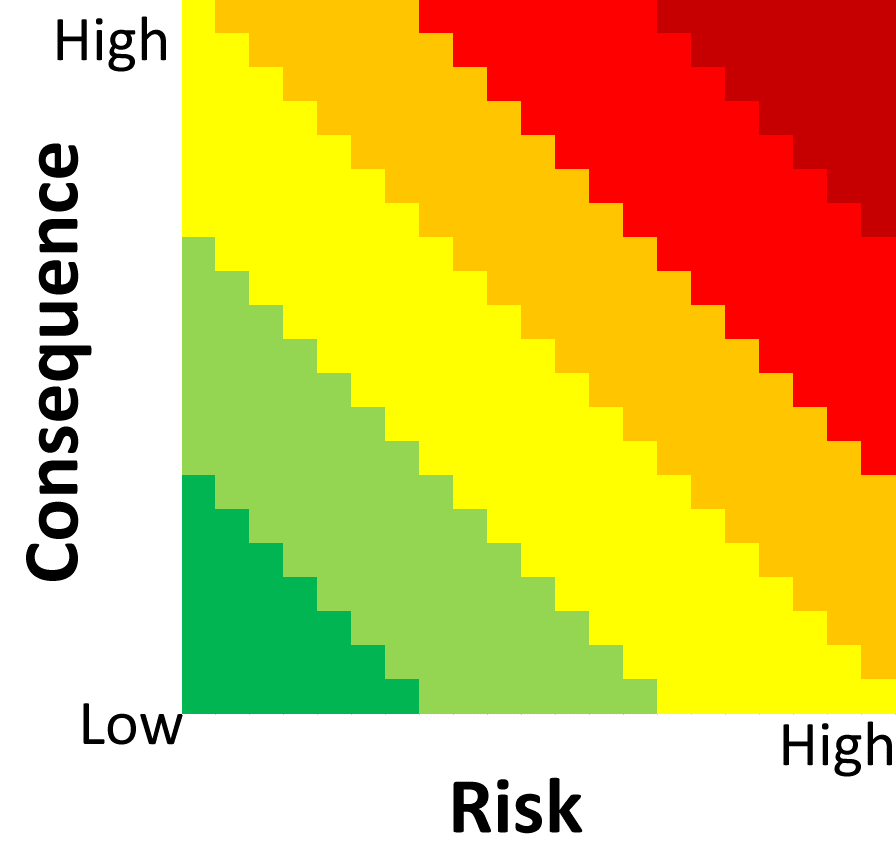
CautiousThis assessment type takes the average (mean) of the worst risk score and the worst consequence score, and scales the result into the range 0 – 100. This might be appropriate for an organization with a risk appetite of Cautious. |
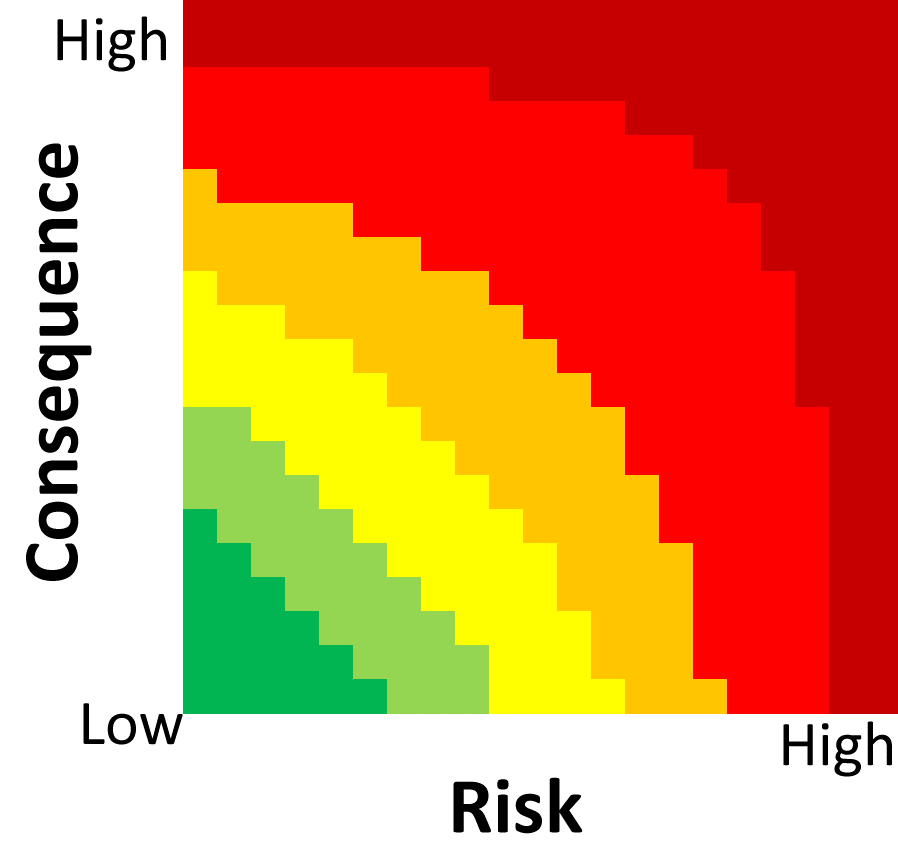
AverseThis assessment type is the inverse of 'open', and works by multiplying the inverse of the worst risk score by the inverse of the worst consequence score, inverting the result, and then scaling the result into the range 0 – 100. This provides a more typical view of risk, so that if either the risk or consequence is high then the result will be high; in other words, it skews high. This might be appropriate for an organization with a risk appetite of Minimalist or Averse. |

|

|

|
These different options are chosen by selecting from the risk appetite drop-down:

Running the assessment
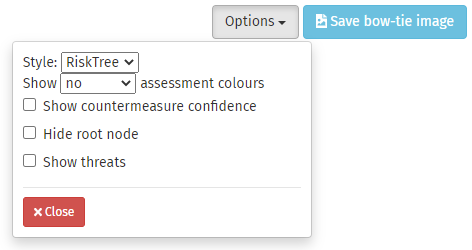
Click on the button to run the assessment. After a few seconds at most (depending on the complexity of your report), you will be notified that the assessment is complete, and the assessment button will be disabled. You can then view the assessment information on the bow-tie diagrams by going to the Bow-tie diagrams tab, selecting an outcome, and clicking the . The items on the bow-tie diagram can be coloured to indicate their scores by using the drop-down to the top-right of the diagram.

The additional information from the assessment will also appear in the pop-up boxes as you move the mouse cursor over the items in the diagram.
Prioritized outcomes
Once the bow-tie diagrams have been assessed, the outcomes table will be populated. This is on the Outcomes tab. It shows the outcomes, sorted from highest to lowest, in a table. The type of assessment used for sorting is shown, and can be changed, using the drop-down above the table. For each outcome, the intrinsic, residual, and target assessments are shown, together with the worst case risk and consequence for each level. The type of assessment that was used is shown above the table, below the assessment button.
