Viewing Bow-tie diagrams
Introduction
Once a risk assessment report contains some bow-tie information, this can be seen via the Bow-tie tab. This tab is illustrated below, and contains three sub-tabs.

Bow-tie diagrams
The Bow-tie diagrams tab lets you view the diagram for each outcome that has been created. Initially, no diagram is shown, and a list of outcomes is in the main dropdown box. To view a diagram, select an outcome and click the button.
If an outcome has been created but then removed from all risks, it remains usable in bow-tie builder. However, without risks it cannot be displayed in a diagram, and so it will appear greyed out in the drop-down list.
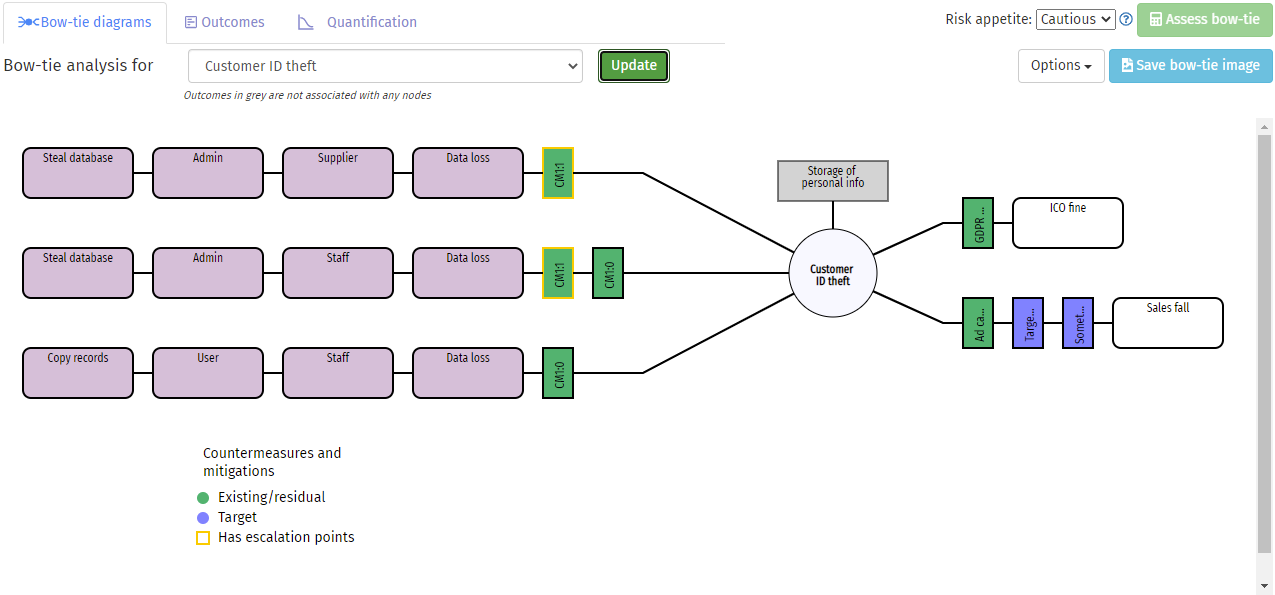
Information pop-ups
Moving your mouse cursor over an item in the diagram will reveal a pop-up box containing more information about it.
Risks
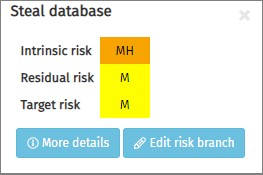
The end risks will show a table of their risk assessment scores, together with two buttons:- – this switches to the risk table, giving full details of the chosen risk
- – this switches to the bow-tie builder for the selected risk branch
Intermediate nodes (i.e., those between the risk at the left, and the outcome) will not display a pop-up.
Countermeasures
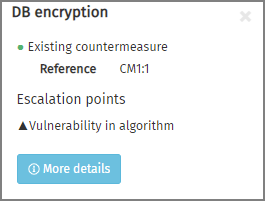
Countermeasure pop-ups show the type of countermeasure (existing or target), the reference number for the countermeasure, a list of any escalation points, and have a button switching to the countermeasure table to show full details of the countermeasure. A dark yellow border on a countermeasure box shows that it has escalation points defined. The colour of the countermeasure box shows whether the countermeasure is existing or target.
Outcomes, consequences, and mitigations
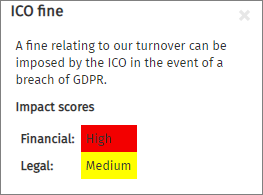
The pop-up box for outcome, consequences, and mitigations will show the outcome description. Consequences also show their impacts, and mitigations show their impact effects and whether the mitigation is existing or target.
 |
 |
 |
 |
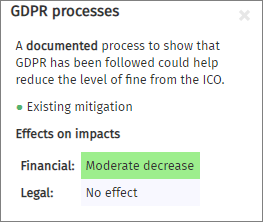 |
| The pop-up boxes for risks… | …countermeasures… | …outcomes… | …consequences… | …and mitigations |
Other features
A bow-tie diagram can be assessed, using the information about its risks, countermeasures, consequences, and mitigations. This process is explained on another page.
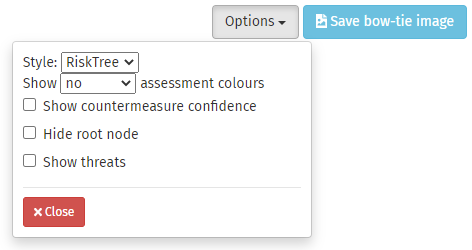
The lets you alter the appearance of the bow-tie diagram. There are two Style options, as illustrated below:
 |
| The RiskTree style |
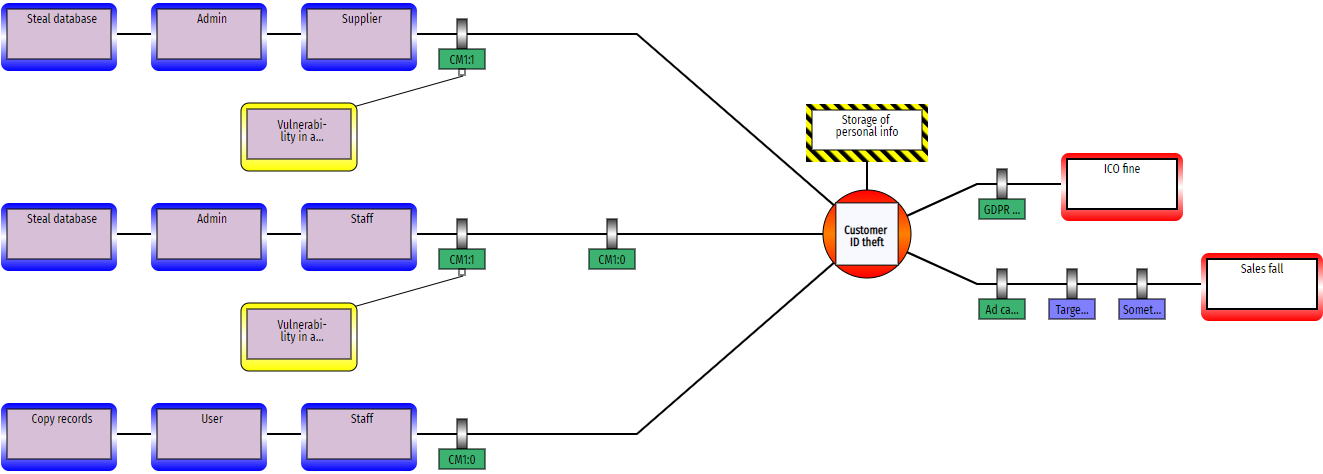 |
| The Bow-tie style, used by some other applications |
The risk nodes can be coloured to show their calculated risk levels by using the drop-down to select the type of assessment to be displayed.
If you have provided countermeasure confidence values, these can be shown on the countermeasure boxes.
All of your risks might come from the same RiskTree, and the root node for that tree can sometimes have the same title as the outcome. If this is the case, ticking the Hide root node box will remove them from the diagram, making it a little smaller.
If you have included a threat assessment in your risk report, ticking the Show threats checkbox will add the threat sources relevant to the risks on the bow-tie diagram to the left, with lines joining them to the appropriate risks. A description of the threat can be viewed by moving your mouse cursor over the threat box. This checkbox will be greyed out if no threat information is held in the report.
A copy of the complete bow-tie diagram can be saved in PNG format by clicking the button.
Outcomes
The Outcomes tab contains a table listing all of the outcomes defined in your report as part of the bow-tie diagrams. For each outcome, the worst-case risk and consequence combination is listed for each of the intrinsic, residual, and target levels (if these are defined). Hazard information is also shown if hazards have been created.

Quantification
If you have added risk quantification information to any of the risks shown in the current bow-tie, a quantification diagram will be shown for them calculated together, along with a table of the included risks.